
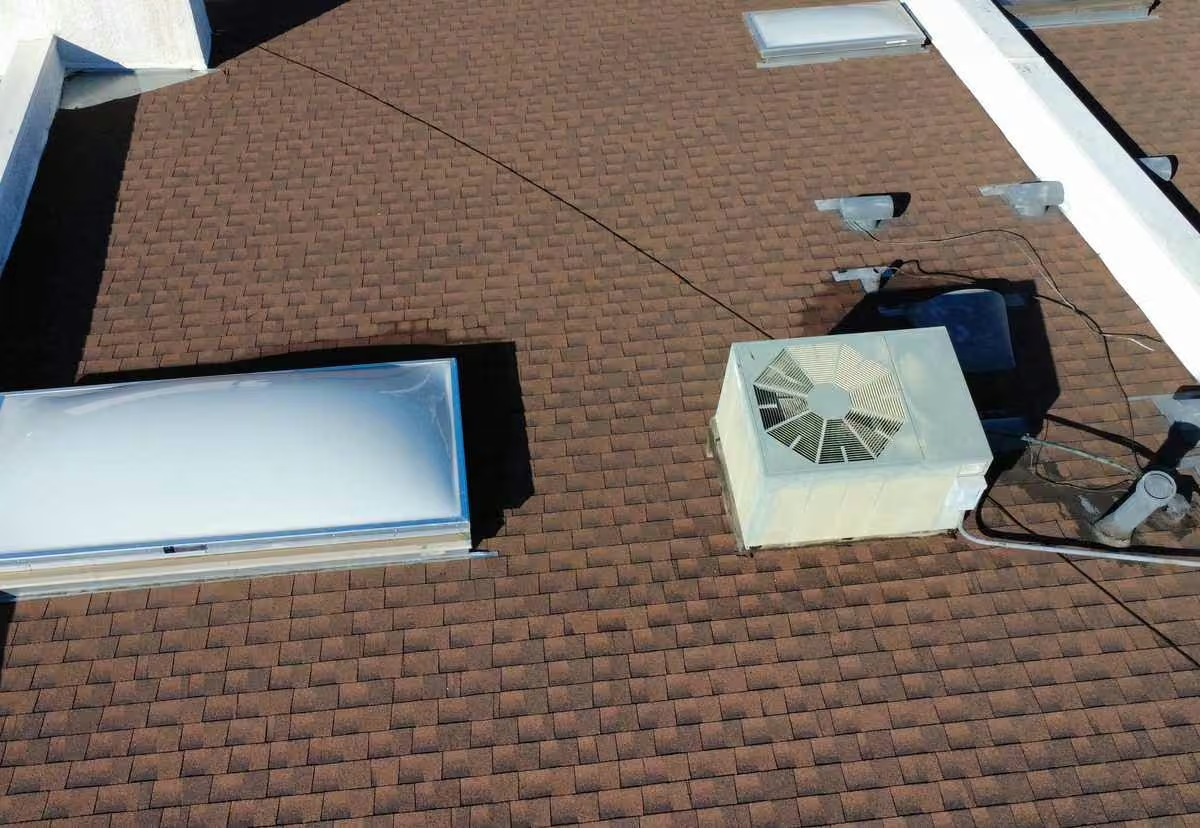
Los Angeles rainfall arrives in a short part of the year, and then it mostly stops. That steady pattern gives owners and managers a simple way to plan roof work. This page pairs rainfall data with plain planning notes for local roofs.
The rainfall figures below come from a long weather record, not from work we did. We keep the measured data and our own planning notes clearly apart. The calendar shows a past pattern, and it never predicts the coming winter.
Monthly historical rainfall calendar
Los Angeles rainfall arrives mostly in the cooler months, and the table below shows each month.
Most Los Angeles rainfall lands between October and April in the long weather record. The months in between stay dry on average, and that pattern repeats year after year. The table below lists the average rainfall for each month at one downtown station.
Read these figures as a pattern over many years, not a plan for one season. Any real season can run much wetter or much drier than these average months.
Station and baseline period
The values are thirty-year normals from a single weather station in Downtown Los Angeles.
The figures come from NOAA monthly climate normals for the Downtown USC campus station. Normals cover a thirty-year baseline, and this set runs from 1991 through 2020. One downtown station cannot speak for every weather pocket in the city.
Units and monthly values
Each month is listed in inches, and the yearly figure is simply those months added up.
Each value is a monthly rainfall normal in inches, using NOAA standard units. The 0.00 shown for August is a rounded average, not a promise of a dry month.
Adding the twelve months shown gives 14.25 inches for the year. October through April holds 13.69 inches, or about 96.1 percent of that total. That yearly figure is our sum of the months shown, not a separate NOAA record.
| Month | Normal rainfall (inches) |
|---|---|
| January | 3.29 |
| February | 3.64 |
| March | 2.23 |
| April | 0.69 |
| May | 0.32 |
| June | 0.09 |
| July | 0.02 |
| August | 0.00 |
| September | 0.13 |
| October | 0.58 |
| November | 0.78 |
| December | 2.48 |
| Sum of displayed months | 14.25 |
| October through April | 13.69 |
Roof inspection planning layer
Plan roof checks during the dry months, since the calendar guides timing and nothing else.
The rainfall numbers are measured data, while the planning notes below are our own judgment. We keep that line clear, because a weather record cannot grade a roof.
Coverings, underlayment, decking and flashing each do a different job on the roof. Dry months give crews steady access, so flashing, sealant and drainage checks are easier to plan. Late summer and early fall suit that kind of broad review.
Planning checks look at the whole roof, while a targeted leak inspection follows an active symptom.
Commercial seasonal planning
Commercial roofs need clear drains and sound surfaces before the wetter months arrive.
Flat and low-slope commercial roofs move water toward drains, scuppers and edge outlets. Debris builds up through the dry season, and it can sit there until the first storms.
Clearing drains and checking roof surfaces in dry weather keeps that work on your own schedule. You can fold a commercial roof inspection into the same late summer round.
Building use, rooftop equipment and access rules all shape how a seasonal check gets planned.
Existing leak symptoms
Signs of a leak need attention now, and this calendar is never a reason to wait.
Ceiling stains, damp drywall and drips during rain show a problem that is already there. Those signs call for a look at the roof, not a note on next season's calendar.
With active signs, ask for a leak inspection at that address, not a seasonal review. A planning review and a leak call answer very different questions.
Method, station and limits
These are thirty-year averages from one station, so their limits matter as much as the numbers.
We asked NOAA for monthly rainfall normals at station USW00093134 and published the values unchanged. The data type is the 1991 through 2020 monthly precipitation normal, reported in inches. We retrieved the figures on September 15, 2026.
We added no second data set and ran no private study of our own. A weather record describes past rainfall, while a commercial roof inspection looks at your building. Any planning advice here is ours, and we mark it that way on the page.
- Thirty-year station normals are past averages, not forecasts or promises about the coming season.
- One Downtown USC station does not represent every Los Angeles microclimate.
- A 0.00 monthly normal is a rounded average, not a promise of no rain.
- The yearly figure is the sum of the months shown, not a separate annual record.
- Roof timing advice here is our own planning guidance, not NOAA advice or a prediction.
Downloadable planning calendar
The same monthly values come as a CSV file you can keep, sort and print.
You can also get the full set as a downloadable rainfall calendar CSV. It holds the twelve monthly values above, plus the station name and baseline period.
Numbers in the file match the table exactly, so nothing is rounded a second time. Mark your own maintenance dates on it, then shift them as your roof and building need.
Common questions about this rainfall calendar
Is a free estimate the same as a detailed roof inspection?
A free estimate, a detailed inspection and a written report are three different requests. Ask for the one that fits your goal, since what you get back is not the same.
Can this calendar tell me whether my roof needs work?
The calendar shows rainfall patterns only, and it says nothing about your own roof. Its condition, slope, layers and any needed local approvals drive the real choices.